1
Football statistics and trends / Re: Basic analysis of football stats
« on: February 08, 2022, 06:09:26 PM »
Basic analysis of football stats (Part 3)
The Corner-stats.com team continues to talk about basic analysis of football statistics based on teams averages. In the previous two parts of our study, we reviewed the basic analysis of football statistics and identified a logical fallacy in this approach to statistical analysis. Now we invite our users to learn how, using simple formulas, you can avoid this error and build a more logical prediction of corners (or any other statistical indicator) in a match. For a better understanding, we recommend that you first read the first and second parts.
So, the Corner-stats.com team analyzed the Italian Serie A match Inter - Venezia and came to the conclusion that the calculated expected corners in the match based on the average individual totals of a team and opponents (6.41 and 3.41) are not correct, since it is logical that Inter, as a strong team, against a weak Venezia must take significantly more corners than its average total, similarly Venezia should take less than its average total.
At the moment, the match has already taken place, the score on corners is 6:0. Therefore, let us recall what the table of corners looked like before the start of our match:
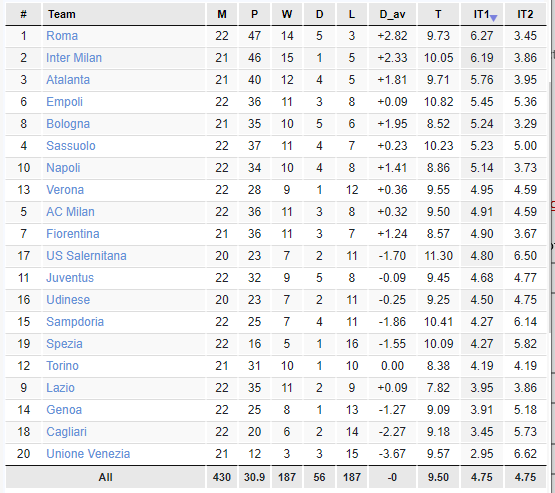
So, Inter average individual total corners is 6.19. But, as noted, we expect Inter to take more corners against a weak Venezia. How to calculate it? The Corner-stats.com team suggests the following easy way:
1. Take the average individual total of the first team (Team1_IT1).
2. Take the average individual total of the opponents of the second team (Team2_IT2) (how many corners the second team allows on average) and calculate how many times it differs from the league average. League averages can be found at the bottom of the league table at Corner-stats.com.
3. Correct Team1_IT1 for the result from p. 2.
Using this algorithm, let's calculate the expected corners for our teams:
For Inter:
1. Team1_IT1 = 6.19;
2. Corr_1 = 6.62 / 4.75 = 1.394 ;
3. Corners_1 = 6.19 * 1.394 = 8.63 .
For Venezia:
1. Team2_IT1 = 2.95;
2. Corr_2 = 3.86 / 4.75 = 0.813 ;
3. Corners_2 = 2.95 * 0.813 = 2.40 .
Thus, according to this algorithm, our forecast for corners in the Inter-Venezia match looks like 8.63 - 2.40, which approximately corresponds to the asian handicap of -6.0 from Inter and the total of 11.0 in an equal line. The Corner-stats.com team believes that this forecast is much more logical than the one that was obtained in the first part of our study.
If you have any questions or comments on this study, you can leave them in our Telegram chat https://t.me/soccer_stats_and_bet . And in our next post, the Corner-stats.com team will offer our users another way to analyze football statistics. Have a good football!
The Corner-stats.com team continues to talk about basic analysis of football statistics based on teams averages. In the previous two parts of our study, we reviewed the basic analysis of football statistics and identified a logical fallacy in this approach to statistical analysis. Now we invite our users to learn how, using simple formulas, you can avoid this error and build a more logical prediction of corners (or any other statistical indicator) in a match. For a better understanding, we recommend that you first read the first and second parts.
So, the Corner-stats.com team analyzed the Italian Serie A match Inter - Venezia and came to the conclusion that the calculated expected corners in the match based on the average individual totals of a team and opponents (6.41 and 3.41) are not correct, since it is logical that Inter, as a strong team, against a weak Venezia must take significantly more corners than its average total, similarly Venezia should take less than its average total.
At the moment, the match has already taken place, the score on corners is 6:0. Therefore, let us recall what the table of corners looked like before the start of our match:
So, Inter average individual total corners is 6.19. But, as noted, we expect Inter to take more corners against a weak Venezia. How to calculate it? The Corner-stats.com team suggests the following easy way:
1. Take the average individual total of the first team (Team1_IT1).
2. Take the average individual total of the opponents of the second team (Team2_IT2) (how many corners the second team allows on average) and calculate how many times it differs from the league average. League averages can be found at the bottom of the league table at Corner-stats.com.
3. Correct Team1_IT1 for the result from p. 2.
Using this algorithm, let's calculate the expected corners for our teams:
For Inter:
1. Team1_IT1 = 6.19;
2. Corr_1 = 6.62 / 4.75 = 1.394 ;
3. Corners_1 = 6.19 * 1.394 = 8.63 .
For Venezia:
1. Team2_IT1 = 2.95;
2. Corr_2 = 3.86 / 4.75 = 0.813 ;
3. Corners_2 = 2.95 * 0.813 = 2.40 .
Thus, according to this algorithm, our forecast for corners in the Inter-Venezia match looks like 8.63 - 2.40, which approximately corresponds to the asian handicap of -6.0 from Inter and the total of 11.0 in an equal line. The Corner-stats.com team believes that this forecast is much more logical than the one that was obtained in the first part of our study.
If you have any questions or comments on this study, you can leave them in our Telegram chat https://t.me/soccer_stats_and_bet . And in our next post, the Corner-stats.com team will offer our users another way to analyze football statistics. Have a good football!


