Recent Posts

Pages: [1] 2 3 ... 10
1
Football statistics and trends / Re: Basic analysis of football stats
« Last post by ShawnK on November 17, 2022, 11:39:00 AM »

If you have any questions or comments on this study, you can leave them in our Telegram chat https://t.me/soccer_stats_and_bet/ . And in our next post, the Corner-stats.com team will offer our users another way to analyze football statistics. Have a good football!

Hmm, interesting... This telegram channel is much more active than the forum :) Not many subscribers though.
2
How do I analyze or bet on football / Re: Live from Antonio
« Last post by ShawnK on November 17, 2022, 11:28:02 AM »
Why did you stop showing these statistics? I find it very interesting. I used to count this data myself...
3
Football statistics and trends / Re: Basic analysis of football stats
« Last post by Antonio on February 08, 2022, 06:09:26 PM »
Basic analysis of football stats (Part 3)

The Corner-stats.com team continues to talk about basic analysis of football statistics based on teams averages. In the previous two parts of our study, we reviewed the basic analysis of football statistics and identified a logical fallacy in this approach to statistical analysis. Now we invite our users to learn how, using simple formulas, you can avoid this error and build a more logical prediction of corners (or any other statistical indicator) in a match. For a better understanding, we recommend that you first read the first and second parts.

So, the Corner-stats.com team analyzed the Italian Serie A match Inter - Venezia and came to the conclusion that the calculated expected corners in the match based on the average individual totals of a team and opponents (6.41 and 3.41) are not correct, since it is logical that Inter, as a strong team, against a weak Venezia must take significantly more corners than its average total, similarly Venezia should take less than its average total.

At the moment, the match has already taken place, the score on corners is 6:0. Therefore, let us recall what the table of corners looked like before the start of our match:


So, Inter average individual total corners is 6.19. But, as noted, we expect Inter to take more corners against a weak Venezia. How to calculate it? The Corner-stats.com team suggests the following easy way:

    1. Take the average individual total of the first team (Team1_IT1).

    2. Take the average individual total of the opponents of the second team (Team2_IT2) (how many corners the second team allows on average) and calculate how many times it differs from the league average. League averages can be found at the bottom of the league table at Corner-stats.com.

    3. Correct Team1_IT1 for the result from p. 2.

Using this algorithm, let's calculate the expected corners for our teams:

For Inter:

    1. Team1_IT1 = 6.19;

    2. Corr_1 = 6.62 / 4.75 = 1.394 ;

    3. Corners_1 = 6.19 * 1.394 = 8.63 .

For Venezia:

    1. Team2_IT1 = 2.95;

    2. Corr_2 = 3.86 / 4.75 = 0.813 ;

    3. Corners_2 = 2.95 * 0.813 = 2.40 .

Thus, according to this algorithm, our forecast for corners in the Inter-Venezia match looks like 8.63 - 2.40, which approximately corresponds to the asian handicap of -6.0 from Inter and the total of 11.0 in an equal line. The Corner-stats.com team believes that this forecast is much more logical than the one that was obtained in the first part of our study.

If you have any questions or comments on this study, you can leave them in our Telegram chat https://t.me/soccer_stats_and_bet . And in our next post, the Corner-stats.com team will offer our users another way to analyze football statistics. Have a good football!
4
Football statistics and trends / Re: Basic analysis of football stats
« Last post by Antonio on February 08, 2022, 06:04:46 PM »
Basic analysis of football stats (Part 2)

In the previous post, Corner-stats.com team reviewed a basic analysis of football statistics and made a prediction for corners in the match Inter Milan - Venezia. Now we will continue our reflections and reveal, in our opinion, an important logical error in this approach to the analysis of statistics. For a better understanding, we recommend that you first read the first part of our study.

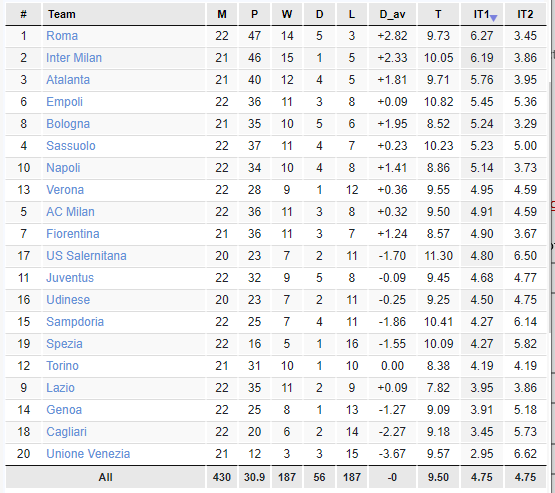
So, based on the average total corners of Inter and Venezia, as well as the average totals of their opponents, we have determined that Inter should take 6.41 corners in the upcoming match, and Venezia 3.41. Accordingly, if Inter would play, for example, with Atalanta, we would get the expected corners for Inter 5.07, and for Atalanta 4.81. It seems that everything is logical: for Inter against weak Venezia, we got a difference of 3 corners, and against strong Atalanta, the difference on corners is minimal.


But let's think - if the average individual total corners for Inter is 6.19, then it is logical that on average against weak teams its total should be higher (say, somewhere around 7.5), against middle teams it will be around 6.19, and against strong it should be lower (somewhere around 4.9). Similarly, if Venezia on average allows 6.62 corners, against strong teams they should allow about 8.0 corners on average, against middle teams about 6.62 and against weak teams about 5.2 corners.

Based on the above, as well as the fact that Inter is a strong team (2nd place on corners), and Venezia is a weak team (last place on corners), then Inter in the upcoming match, of course, should take significantly more corners than its average individual total. If we take the approximate figures from the previous paragraph, then the individual total corners of Inter should definitely not be less than 7.5 (rather (7.5+8.0)/2=7.75 ), and this is significantly more than 6.41, as we did in the calculations in the first part of the study.

We make a logical conclusion that the basic analysis, how many corners a team takes on average, and how many corners an opponent allows on average, does not give us the correct results, but almost always underestimates the difference between the teams. And the greater the gap in strength between the teams, the greater will be the underestimation of the difference. We also draw your attention to the fact that the conclusion obtained is true not only for corners, but also for all other statistical indicators (goals, shots, throw-ins, etc.).

We hope that you have benefited from our research and that it will help you in your strategies. If you do not agree with us or have other comments on this matter, you can post them in our Telegram chat https://t.me/soccer_stats_and_bet .

P.S. In the current article, we used approximate calculations (by eye), but how this can be calculated more accurately using formulas, the Corner-stats.com team will tell in our next post.
5
Football statistics and trends / Basic analysis of football stats
« Last post by Antonio on February 08, 2022, 05:56:22 PM »
Basic analysis of football stats (Part 1)

Greetings to all fans of football and football statistics!

Today the Corner-stats.com team decided to touch upon an interesting issue of basic analysis of teams statistics for the upcoming football match, which can give everyone serious food for thought.

So, for example, let's take the Italian Serie A match between Inter and Venezia, which will take place on 01/22/2022, and try to predict the corners in this match.

Consider the summary table of corners of the current season:


Corner-stats.com team proposes to build corners prediction only on the basic statistics from this table and discard all other factors (field factor (home-away), change of a coach, games with similar opponents, or others). So, Inter delivers an average of 6.19 corners per match, and Venezia delivers 2.95 corners per match, which we may take as our forecast.

But you may rightly note that corners depend not only on how the team takes them, but also on how the opponent allows corners at its goal. In our table, this corresponds to the opponent's corners total. To take into account at the same time how a team delivers and how an opponent allows corners, we will use a simple formula for the arithmetic mean of these indicators:

Expected corners Team 1 (Corners_1) = ( Team 1 individual total (Team1_IT1) + Team 2 opponents' total (Team2_IT2) ) / 2;

Expected corners Team 2 (Corners_2) = ( Team 2 individual total (Team2_IT1) + Team 1 opponents' total (Team1_IT2) ) / 2;

In the case of Inter - Venezia match, we will receive the following data:

Corners_1 = ( 6.19 + 6.62 ) / 2 = 6.41

Corners_2 = ( 2.95 + 3.86 ) / 2 = 3.41

Thus, we expect that Inter will deliver 6.41 corners in the upcoming match, and Venezia 3.41 corners, which approximately corresponds to a handicap of -3 and a total of 9.5 corners (you can calculate the bookmaker's line more accurately based on the expected figures of the teams using the tool Calculate line on Corner-stats football stats service).

And now we want to ask our users, do you think this calculation is logical and correct? Or do you have any doubt about it? We invite you to leave your comment on this issue in our Telegram chat https://t.me/soccer_stats_and_bet , and the Corner-stats.com team will provide its own answer in our next post.
6
About Corner-stats.com service / Re: Corner-stats.com service updates
« Last post by JackRussel on November 01, 2021, 10:05:46 AM »
Added the relation of teams' statistics at Home vs. at Away

If you are already a user of the service of advanced football stats Corner-stats.com, then of course you are aware of its tool Relations of statistics. An example of using this tool can be found here https://ru.corner-stats.com/24-09-2020-milan-bode-glimt-liga-evropy-otsenka-uglovyh-na-osnovanii-otnosheniy-pokazateley/info/329/BP


No matter how many times I tried to predict the number of corners in the next game based on statistics from previous games, nothing worked in the long run. Maybe I'm doing something wrong?
7
Football statistics and trends / Re: Hotline!!!
« Last post by JackRussel on November 01, 2021, 09:40:51 AM »
The fresh set of hotlines has been prepared for you!   :o :o :o

Nagoya Grampus conceded only 1 goal in 8 matches this season (0.13 on avg.)  | Get full stats >>
11/04    Oita - Nagoya Grampus | You may bet on team goals in this match at Bet365 >>

Cagliari didn't won on cards in 7 of 9 matches with similar opponents this season  | Get full stats >>
11/04    Inter Milan - Cagliari | You may bet on handicap on cards in this match at Pinnacle >>

West Ham has the most shots from goal mouth this season in EPL (1.80 on avg.)  | Get full stats >>
11/04    West Ham - Leicester | You may bet on team goals in this match at Bet365 >>

Avg. team total goals of Istra-1961 increased from 0.7 to 1.5 after the new coach appointment on 11/02/2021  | Get full stats >>
11/04    Istra 1961 - Hajduk Split | You may bet on team goals in this match at Pinnacle >>

Real Betis won on corners in the 1st half in 11 of 14 matches at home this season (+1.57 avg. diff.)  | Get full stats >>
11/04    Real Betis - Atletico Madrid | You may bet on handicap on corners in this match at Bet365 >>

Such an interesting forum thread, and something stopped being updated. I used to like everything :)
8
Discussions about the football matches / EURO 2020 previews
« Last post by Corner-stats_support on July 02, 2021, 07:05:55 PM »
Corner-stats.com team welcome to all football fans! Final stages are coming at EURO 2020 and we wish you all a great football.
In this preview, we will consider the statistics of violations by teams. We want to note right away that the current EURO is marked by a small number of cards and fouls. Perhaps this is due to a decrease in the intensity of the teams' play in the context of the coronavirus, or perhaps this is a long-term trend. A comparison of the last three EUROs clearly demonstrates this:

                     Foul   Cards
EURO 2012    4.03   27.87
EURO 2016    3.86   24.31
EURO 2020    3.05   21.95

Let's analyze in more detail the statistics of the teams of Ukraine and England, which will play the last quarter-final on Saturday. Note that both teams had an ambiguous previous meetings at EURO, alternating between a good game and a game close to failure.
The national team of Ukraine, after the appointment of Andriy Shevchenko as the head coach, switched to more technical football with greater ball control, which, among other things, influenced a small number of team fouls. Ukraine has the lowest individual total fouls at EURO 2020 (7.75). The Ukrainian players received only 3 cards, while 2 of them were not received for a foul (Shaparenko for simulation, Yarmolenko for disputes with a referee). One more card, which is not counted, was received by Dovbyk in extra time for taking off his shirt after scoring a goal.
In turn, England have an average individual total fouls of 11.0 with 4 cards (3 of them were shown in the 1/8 match against Germany).
The ratio of fouls to cards is one of the lowest at EURO for both Ukraine and England (10.33 and 11.0), that is, if the teams foul, then these fouls are not rough.
In addition, we will consider the statistics of tackles and aerials of the teams, which affects violations. Ukraine has a larger team total tackles (15.5 against 10.25 for England), but England is leading in aerials won (18.0 against 8.25).
For other statistics for the EURO 2020 teams, as well as for the ratio of statistics, see Corner-stats.com https://corner-stats.com/european-championships/national/tournament/71
Once again, we wish you all good football, and may the strongest win!


9
Graphs added to interval tables

The Corner-stats.com team has developed a useful addition to intervals tables. Recall that the intervals tables allow you to compare the statistics of teams or referees at different intervals of a match (15 minutes each). And the new development of our service allows you to view these statistics in the form of graphs.


The X-axis of the graph contains the match intervals (0-15, 16-30 ... 76-FT), and the Y-axis is the value of the team's (referee's) statistical indicator on the interval (as a percentage of the full match). By comparing graphs, Corner-stats.com users have the ability to easily analyze the game of teams or referees by intervals and determine the most interesting intervals for the upcoming match. Please note that the graphs are available for tables of intervals of goals, corners and cards of almost all tournaments on the service Corner-stats.com, as well as for all other types of statistics (fouls, shots, offsides, throw-ins ...) for the top 30 most popular leagues of the world. In addition, the intervals graphs are also present in the referees statistics of a tournament.


You can discuss this function, as well as any other tools of the Corner-stats.com service, in our telegram group: https://t.me/soccer_stats_and_bet
10
Real Madrid - Chelsea 27/04/2021. CL semi final (1st match). Statistical preview.

The central today's match (April 27, 2021) is the first Champions League semi-final match between Real Madrid and Chelsea.
The Corner-stats.com team has prepared some important points to consider when analyzing the match:
 - For Real, today's match will be the 46th of the season, while Chelsea will play its 51st match;
 - in parallel with the Champions League, both Real and Chelsea are fighting a difficult fight in the national championships (Real for the 1st place, Chelsea for the Champions League zone);
 - at the beginning of the year, Chelsea changed coach, under whose leadership the team has already played 21 matches. At the same time, the team's performance has dropped significantly (avg. total goals is only 1.71). You can check other Chelsea stats with a new coach on the match page using the Current Coach tool https://corner-stats.com/real-madrid-chelsea-27-04-2021/uefa-champions-league-europe/match/ 368406
 - in the 1st quarterfinal match of the Champions League against Liverpool (at home 3-1) Real completely dominated in the 1st half, having much more shots, crosses, tackles, corners and dangerous chances, in the 2nd half the game was statistically more or less equal;
 - in the 1st quarterfinal match of the Champions League against Porto (away 2-0) Chelsea lost in the 1st half on shots 8-1, corners 7-2, crosses 12-7, tackles 9-6, while won 1 half 1-0. In the second half, the game was statistically approximately equal;
 - referee of the match D. Makelli has an average total cards (1+2) of 5.17 in international matches (compared to 3.32 in the Dutch Eredivisie).
We wish you interesting statistical findings and good football!
Pages: [1] 2 3 ... 10