

 Real Betis - Panathinaikos
 Chapecoense - Corinthians
 Bournemouth - Man Utd
Hotline
Hotline


 Eyüpspor - Trabzonspor

Team
Referee
Compare Teams
Select Tournament
Main
England Spain Germany Italy France Ukraine Russia JapanClub International
World Europe South-america Asia Nc-america Africa OceaniaNational teams
World (National) Europe (National) South America (National) Asia (National) NC America (National) Africa (National) Oceania (National)Europe
Austria Azerbaijan Belarus Belgium Bosnia-herzegovina Bulgaria Croatia Cyprus Czech-republic Denmark Estonia Finland Georgia Greece Hungary Iceland Ireland-republic Israel Kazakhstan Latvia Lithuania Netherlands Northern-ireland Norway Poland Portugal Romania Scotland Serbia Slovakia Slovenia Sweden Switzerland Turkey WalesSouth America
Argentina Bolivia Brazil Chile Colombia Ecuador Paraguay Peru Uruguay VenezuelaAsia
Australia Bahrain China-pr Chinese-taipei Hong-kong India Indonesia Korea-republic Qatar Saudi-arabia Singapore Tajikistan Thailand Turkmenistan United-arab-emiratesNorth Central American and Caribbean
Canada Costa-rica El-salvador Honduras Mexico Nicaragua United-statesAfrica
Algeria Egypt Morocco Nigeria South-africaOceania
New-zealandAnalytics
In this article, the Corner-stats.com team explains the home-away filter, as well as a separate unique tool that allows you to ..
TOP MATCHES
 88' 88' |
|
Aston Villa VS Lille Free! |
| 88' |
|
Roma VS Bologna |
A tool for calculating the correlation coefficients of team indicators is implemented on the tournament page
Correlation coefficient - an indicator characterizing the strength of the statistical relationship of two or more random variables.
The values of the correlation coefficient are always in the range from -1 to 1 and are interpreted as follows:
- if the correlation coefficient is close to 1, then a positive correlation is observed between the variables. In other words, there is a high degree of connection between the variables. In this case, if the values of the variable x increase, then the output variable will also increase;
- if the correlation coefficient is close to -1, this means that between the variables there is a strong negative correlation. In other words, the behavior of the output variable will be the opposite of the behavior of the input. If the value of x increases, then y will decrease, and vice versa;
- intermediate values close to 0 will indicate a weak correlation between the variables and, accordingly, a low dependence. In other words, the behavior of the variable x will not completely (or almost completely) affect the behavior of y (and vice versa).
Obviously, if the correlation between the variables is high, then, knowing the behavior of the input variable, it is easier to predict the behavior of the output, and the resulting prediction will be more accurate (they say that the input variable "explains" the output well). The higher the correlation is observed between the variables, the more obvious is the relationship between them, for example, the interdependence between the height and weight of people.
According to popular estimates, the correlation coefficient is considered high (significant) if it is greater than 0.7 (modulo).
Let's look at a few examples of how to use correlation in the analysis of football statistics.
1. Using the example of the English Premier League, we analyze the relationship between crosses and corners. It is logical to assume that there should be a direct relationship between these indicators (positive correlation), because the more a team makes crosses, the greater the probability that the ball will go to the corner. To see the correlation coefficients of the teams, open the Relations tab and select the necessary indicators (the correlation is in the last 3 columns):
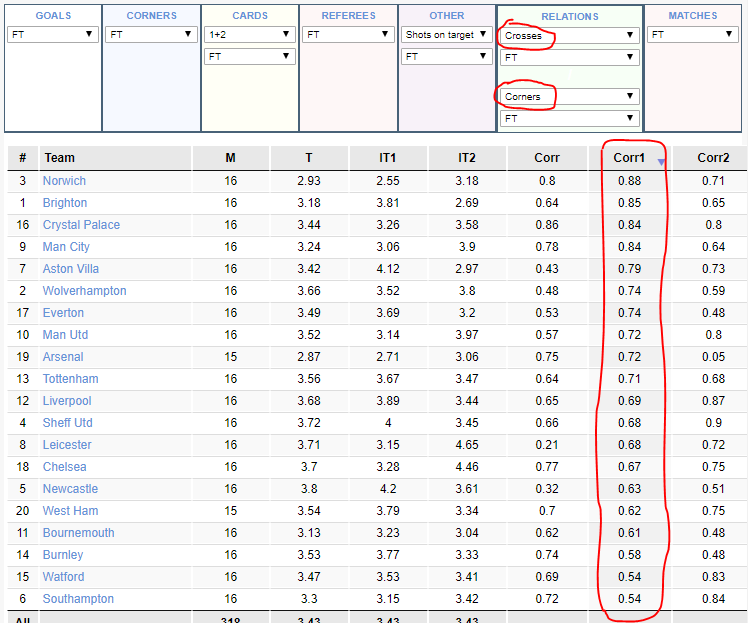
Indeed, as can be seen from the screenshot, all teams have a positive correlation coefficient between crosses and corners, but if Norwich has this coefficient of 0.88, then Southampton has only 0.54. That is, if we assume that Norwich will have many crosses in the box in the upcoming match (for example, due to the presence of strong flank players or high forwards in the line-up), then the number of team corners should also be large.