

 Sheff Wed - Watford
 Atalanta - Bayern Munich
Hotline

Hotline


 Lazio - Sassuolo
 Eyüpspor - Kocaelispor Kulübü

 Slavia Prague - Sparta Prague
Team
Referee
Compare Teams
Select Tournament
Main
England Spain Germany Italy France Ukraine Russia JapanClub International
World Europe South-america Asia Nc-america Africa OceaniaNational teams
World (National) Europe (National) South America (National) Asia (National) NC America (National) Africa (National) Oceania (National)Europe
Austria Azerbaijan Belarus Belgium Bosnia-herzegovina Bulgaria Croatia Cyprus Czech-republic Denmark Estonia Finland Georgia Greece Hungary Iceland Ireland-republic Israel Kazakhstan Latvia Lithuania Netherlands Northern-ireland Norway Poland Portugal Romania Scotland Serbia Slovakia Slovenia Sweden Switzerland Turkey WalesSouth America
Argentina Bolivia Brazil Chile Colombia Ecuador Paraguay Peru Uruguay VenezuelaAsia
Australia Bahrain China-pr Chinese-taipei Hong-kong India Indonesia Korea-republic Qatar Saudi-arabia Singapore Tajikistan Thailand Turkmenistan United-arab-emiratesNorth Central American and Caribbean
Canada Costa-rica El-salvador Honduras Mexico Nicaragua United-statesAfrica
Algeria Egypt Morocco Nigeria South-africaOceania
New-zealandAnalytics
In this article, the Corner-stats.com team explains the home-away filter, as well as a separate unique tool that allows you to ..
TOP MATCHES
| 11/03 |
|
PSG VS Chelsea Free! |
 90'
90'Analysis of the Confederations Cup
Confederations Cup will be held from the 17th of June to the 2nd of July in Russia. It’s football tournament between national teams. The teams are divided into two groups: Group A and Group B.
Before analysis new tournament let’s recall to our memory some interesting facts about tournament 2013:
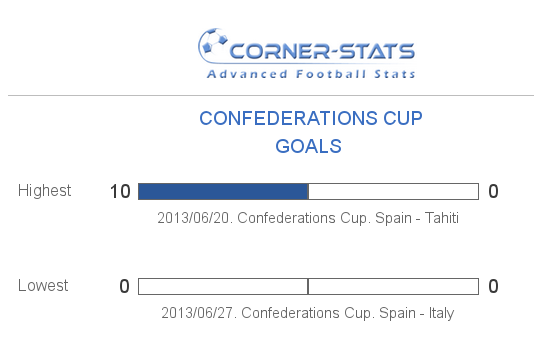
- 10:0 enormous win Spain over Tahiti;
-
0 – minimum quantity of scored goals in the match (Spain-Italy).
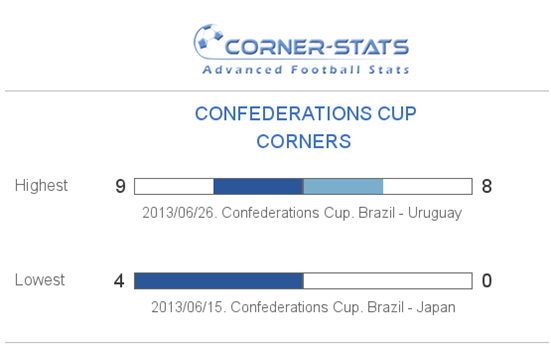
- 17 – maximum quantity of corners in the match (Brazil – Uruguay);
-
4 – minimum quantity of corners per match (Brazil – Japan).
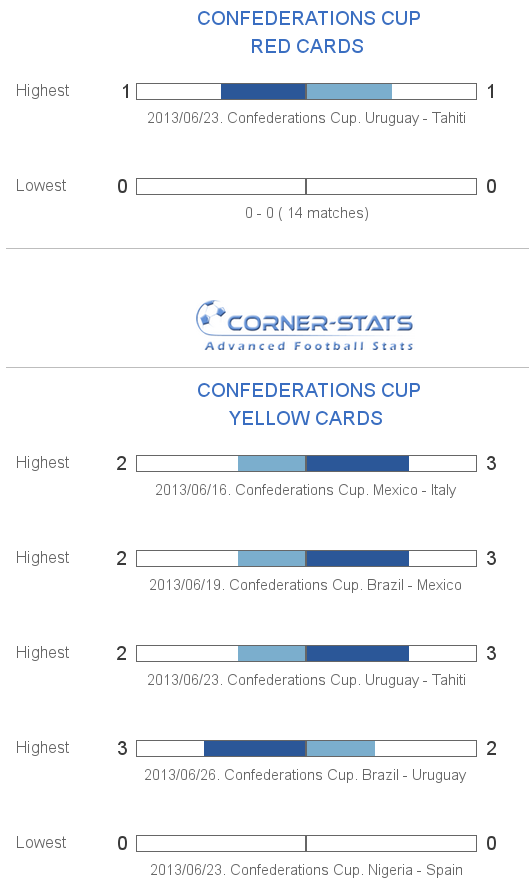
- 5 – Maximum quantity of yellow cards per the match ( Mexico – Italy, Brazil – Mexico, Uruguay – Tahiti, Brazil – Uruguay).
-
2 – Maximum quantity of red cards per match that a referee showed in the match – Uruguay – Tahiti).
Let’s move to the tournament 2017 and try to estimate the shape of teams based on the sample of last 10 international matches apart from friendly matches (you can always find this information on the site https://corner-stats.com/):
Group A
| № | Team | M | P | W | D | L | Diff | Diff_av | T | IT1 | IT2 |
|---|---|---|---|---|---|---|---|---|---|---|---|
| 1 | Mexico | 10 | 19 | 5 | 4 | 1 | 13 - 11 | +0.2 | 2.4 | 1.3 | 1.1 |
| 2 | NewZealand | 10 | 22 | 6 | 4 | 0 | 17 - 3 | +1.4 | 2 | 1.7 | 0.3 |
| 3 | Portugal | 10 | 21 | 6 | 3 | 1 | 25 - 4 | +2.1 | 2.9 | 2.5 | 0.4 |
| 4 | Russia | 10 | 16 | 5 | 1 | 4 | 17 - 9 | +0.8 | 2.6 | 1.7 | 0.9 |
and Group B:
| № | Team | M | P | W | D | L | Diff | Diff_av | T | IT1 | IT2 |
|---|---|---|---|---|---|---|---|---|---|---|---|
| 1 | Germany | 10 | 25 | 8 | 1 | 1 | 32 - 4 | +2.8 | 3.6 | 3.2 | 0.4 |
| 2 | Australia | 10 | 22 | 6 | 4 | 0 | 26 - 9 | +1.7 | 3.5 | 2.6 | 0.9 |
| 3 | Cameroon | 10 | 22 | 6 | 4 | 0 | 11 - 3 | +0.8 | 1.4 | 1.1 | 0.3 |
| 4 | Chile | 10 | 15 | 4 | 3 | 3 | 11 - 9 | +0.2 | 2 | 1.1 | 0.9 |
We see that if to compare the results of these 10 matches, Germany, Portugal, New Zealand and one of two teams – Australia and Cameroon will play in the quarterfinal. But don’t rule out other teams, especially national team of Russia, counting to attention a well-known fact that the team plays better at home.
Of course, this data is not correctly reflected future matches (because teams played with different on strength opponents) that’s why such analytics can be considered as the first step towards estimating upcoming matches. More correct information about some specific upcoming match you can find on https://corner-stats.com on the page of the match in section of similar matches (matches of teams with opponents approximately equal by strength to current one).
What’s up with corners?
Group A
| № | Team | M | W | D | L | Diff | Diff_av | T | IT1 | IT2 |
|---|---|---|---|---|---|---|---|---|---|---|
| 1 | Mexico | 10 | 6 | 2 | 2 | 57 - 48 | +0.9 | 10.5 | 5.7 | 4.8 |
| 2 | NewZealand | |||||||||
| 3 | Portugal | 10 | 8 | 0 | 2 | 70 - 24 | +4.6 | 9.4 | 7 | 2.4 |
| 4 | Russia | 10 | 7 | 0 | 3 | 56 - 40 | +1.6 | 9.6 | 5.6 | 4 |
and Group B:
| № | Team | M | W | D | L | Diff | Diff_av | T | IT1 | IT2 |
|---|---|---|---|---|---|---|---|---|---|---|
| 1 | Germany | 10 | 9 | 1 | 0 | 83 - 29 | +5.4 | 11.2 | 8.3 | 2.9 |
| 2 | Australia | 10 | 9 | 0 | 1 | 76 - 25 | +5.1 | 10.1 | 7.6 | 2.5 |
| 3 | Cameroon | 10 | 6 | 0 | 4 | 47 - 37 | +1 | 8.4 | 4.7 | 3.7 |
| 4 | Chile | 10 | 5 | 1 | 4 | 41 - 39 | +0.2 | 8 | 4.1 | 3.9 |
As you can see on individual total corners the leader is Germany that takes on average 8.3 corners per match. The second is Australia (7.6 corners per match) and the third is Portugal with the indicator of 7.0 corners per match. These three teams are completely leaders with a huge gap with the rest participants of the tournament.
And Mexico is the leader on being taken corners by opponents.
To answer the question about the rudest teams, select the statistics on cards (tab “Cards (whole match)”) for each team for last 10 matches:
Group A
| № | Team | M | Diff_yc | T_yc | IT1_yc | IT2_yc | Diff_rc | T_rc | IT1_rc | IT2_rc | T(1+2) | T(2+5) | T(10+25) |
|---|---|---|---|---|---|---|---|---|---|---|---|---|---|
| 1 | Mexico | 10 | 16 - 21 | 3.7 | 1.6 | 2.1 | 1 - 0 | 0.1 | 0.1 | 0 | 3.90 | 7.90 | 39.50 |
| 2 | NewZealand | 10 | 19 - 9 | 2.8 | 1.9 | 0.9 | 0 - 1 | 0.1 | 0 | 0.1 | 3.00 | 6.10 | 30.50 |
| 3 | Portugal | 10 | 14 - 23 | 3.7 | 1.4 | 2.3 | 0 - 3 | 0.3 | 0 | 0.3 | 4.30 | 8.90 | 44.50 |
| 4 | Russia | 10 | 11 - 13 | 2.4 | 1.1 | 1.3 | 0 - 1 | 0.1 | 0 | 0.1 | 2.60 | 5.30 | 26.50 |
And Group B:
| № | Team | M | Diff_yc | T_yc | IT1_yc | IT2_yc | Diff_rc | T_rc | IT1_rc | IT2_rc | T(1+2) | T(2+5) | T(10+25) |
|---|---|---|---|---|---|---|---|---|---|---|---|---|---|
| 1 | Germany | 10 | 10 - 16 | 2.6 | 1 | 1.6 | 0 - 0 | 0 | 0 | 0 | 2.60 | 5.20 | 26.00 |
| 2 | Australia | 10 | 14 - 15 | 2.9 | 1.4 | 1.5 | 0 - 0 | 0 | 0 | 0 | 2.90 | 5.80 | 29.00 |
| 3 | Cameroon | 10 | 13 - 10 | 2.3 | 1.3 | 1 | 0 - 0 | 0 | 0 | 0 | 2.09 | 4.18 | 20.91 |
| 4 | Chile | 10 | 25 - 24 | 4.9 | 2.5 | 2.4 | 2 - 2 | 0.4 | 0.2 | 0.2 | 5.70 | 11.80 | 11.80 |
The statistics speak for themselves:
- superiority on quantity of got cards is for sure Chili (25 yellow cards and +2 red ones);
- the second place is New Zealand (19 yellow cards + 0 red cards)
- the third is Mexico (16 yellow cards + 1 red ones).
The most peaceful team in this group is Germany (10 yellow cards + 0 red ones) and Russia (11 yellow cards + 0 red ones).
Of course, many things on the field depend on a referee that serves a match. There is the list of referees for tournament FIFA (the stats of these referees for last 20 matches):
| Confederation | Referee | M | Q_yc | T_yc | Q_rc | T_rc | T(1+2) | T(2+5) | T(10+25) | Pen | Fouls |
|---|---|---|---|---|---|---|---|---|---|---|---|
| AFC | Fahad Al-Mirdasi | 20 | 62 | 3.1 | 2 | 0.1 | 3.30 | 6.70 | 33.50 | 15% | 29.42 |
| Alireza Faghani | 20 | 72 | 3.6 | 1 | 0.05 | 3.70 | 7.45 | 37.25 | 25% | 27.4 | |
| CAF | Bakary Gassama | 11 | 27 | 2.45 | 0 | 0 | 2.45 | 4.91 | 24.55 | 9% | 36.78 |
| CONCACAF | Mark Geiger | 20 | 73 | 3.65 | 2 | 0.1 | 3.85 | 7.80 | 39.00 | 25% | 26.6 |
| CONMEBOL | Néstor Pitana | 20 | 99 | 4.95 | 6 | 0.3 | 5.55 | 11.40 | 57.00 | 15% | 29.85 |
| Wilmar Roldán | 20 | 102 | 5.1 | 8 | 0.4 | 5.90 | 12.20 | 61.00 | 15% | 29 | |
| OFC | - | ||||||||||
| UEFA | Milorad Mažić | 20 | 58 | 2.9 | 1 | 0.05 | 3.00 | 6.05 | 30.25 | 15% | 28.75 |
| Gianluca Rocchi | 20 | 82 | 4.1 | 7 | 0.35 | 4.80 | 9.95 | 49.75 | 35% | 25.7 | |
| Damir Skomina | 20 | 67 | 3.35 | 0 | 0 | 3.35 | 6.70 | 33.50 | 20% | 23.25 |
Pen is the percent of the matches in which a referee awarded a penalty at least once.
More detailed statistics about each referee you can always find on the site https://corner-stats.com. For example, for the referee Gianluca Rocchi it will looks in such way:
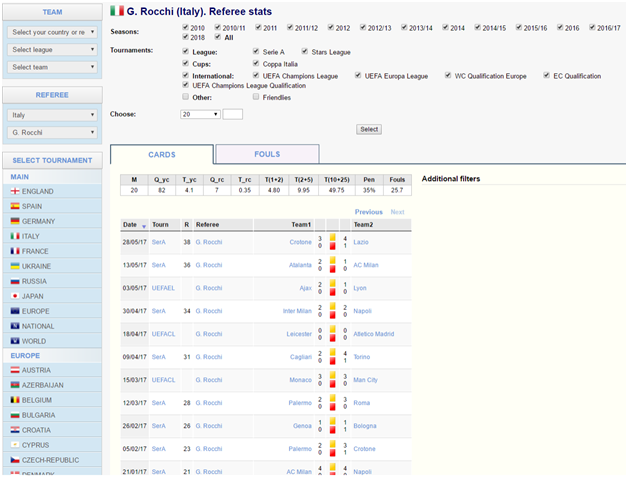
You may also be interested in our previews